The secret/graph
From LostRing
(Difference between revisions)
| Revision as of 14:29, 2 April 2008 (edit) Thebruce (Talk | contribs) m (New page: == The Secret Graph == * When inputting the command '''"RUN GRAPH"''' into the omphaputer, the rotating globe is replaced with a graph displaying seven coloured trends. * At top and ce...) ← Previous diff |
Revision as of 14:34, 2 April 2008 (edit) (undo) Thebruce (Talk | contribs) m Next diff → |
||
| Line 2: | Line 2: | ||
| * When inputting the command '''"RUN GRAPH"''' into the [[omphaputer]], the rotating globe is replaced with a graph displaying seven coloured trends. | * When inputting the command '''"RUN GRAPH"''' into the [[omphaputer]], the rotating globe is replaced with a graph displaying seven coloured trends. | ||
| * At top and center is an image of a portion of [[Schroedinger's equation]] | * At top and center is an image of a portion of [[Schroedinger's equation]] | ||
| - | {|cellpadding="7" | + | :{|cellpadding="7" |
| |bgcolor="black"|[[Image:ShcroedingersEquation.png]] | |bgcolor="black"|[[Image:ShcroedingersEquation.png]] | ||
| |} | |} | ||
Revision as of 14:34, 2 April 2008
The Secret Graph
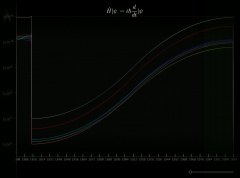
- When inputting the command "RUN GRAPH" into the omphaputer, the rotating globe is replaced with a graph displaying seven coloured trends.
- At top and center is an image of a portion of Schroedinger's equation
- The horizontal axis indicates year, running from 1800 to 2008
- The vertical axis has labels indicating large numbers (perhaps frequencies) from 1x10⁵ through 1x10¹¹
- A slider in the corner allows the viewer to zoom in to the graph, and slide a 'window' along its length.
Oddities
- it's yet unknown what the graph is depicting
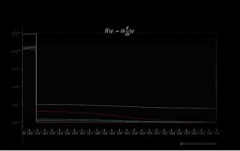
- There are two 'forms' the graph seems to randomly switch between throughout the week (usually when the omphaputer updates), which makes it harder to figure out what the graph is actually depicting.
 (the "S" form) | -- | 
|


